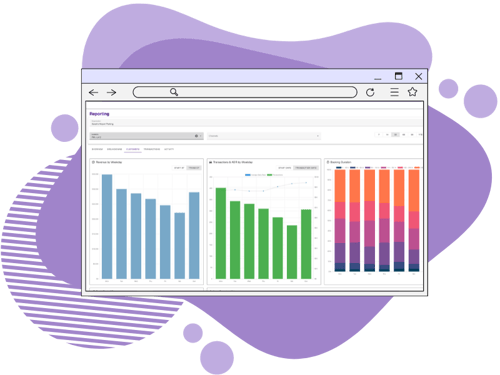
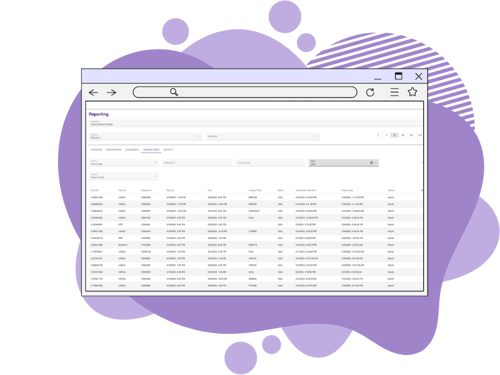
See which channels are "winning", which verticals are driving revenue, how much money you can expect to see in the bank each month, & so much more.
Do less analysis, get more data.
Ocra instantly surfaces insights that take operators hours of manual analysis to uncover.
Growth Revenue By Channel
See which channels are "winning" by location or group of locations
Reporting by Payout Date
Know how much cash will land in the bank each month, computed by channel payout date
Revenue Rollup by Vertical
Get an overview of which verticals are driving the most revenue
Occupancy Heat Map
View at a glance when your locations are busiest, with exact transaction counts
New vs. Returning Customers
Understand customer acquisition and retention by channel & location
Booking Duration Fill Chart
View how many transactions fall into which duration bracket, calculated by average length of stay
One place to view all reports (finally).
Ocra centralizes reporting from siloed channels: SpotHero, ParkWhiz, On Air, APR, CAP, & more.


New data points, dashboards, tooltips, & filters.
Highly configurable, incredibly powerful, & 99% directional for good clear decision-making.

Revenue Breakdown
-
Revenue Breakdown By Day: See gross revenue stacked up by channel with dollar amounts
-
Average daily rates
-
Average daily transactions
-
Multi-location selects and pre-built views (7 days, 14 days, 30 days, 90 days, YTD)

Customers Dashboard
-
Day-of-week breakdown of transactions & rates
-
Booking duration chart calculated based on average length of stay
-
Occupancy heat map showing peak rental times
-
New vs. frequent customer breakdown

Revenue By Payout Date
-
Shows with 99% accuracy how much revenue will land in the bank each month
-
Computes revenue based on payout date (differs from channel to channel)
-
Eliminates hours of financial analysis

